
Prepare environment for work in
ShapeToTab (created by Richard Leeke)
download release-1600-gdal-1-9-0-mapserver-6-0-1 from
http://www.gisinternals.com/sdk/PackageList.aspx?file=release-1600-gdal-1-9-0-mapserver-6-0-1.zip
Unzip both and place them on your computer.
ShapeToTab consists of (my system is not in English, sorry):

I placed GDAL inside my ShapeToTab file:

Open ShapeToTab.yml file in Notepad or in Notepad++, you will see this:

You have to edit path to your GADM file.
If you don't know much about paths to files, you can check GADM's path by right clicking on the GADM file and selecting from the menu Properties, then copy Location 'C:\ShapeToTab' and add '\ with name of the file” (in my case it looks like 'C:\ShapeToTab\GDAL_1.9') your path is ready, you can paste it in ShapeToTab.yml file.

Now click on 'Sample' file, you should see:

This step is not a must but I believe that using QGIS brings many possibilities so I recommend it. Download open source QGIS from http://www.qgis.org/en/site
In QGIS we can learn more about our 'porirua-tsunami-evacuatio.shp' file, there are three importing options.
1. upper menu => Layer => Add Vector Layer
2. by clicking on the icon
3. combination of Ctrl+Shift+V

Add the vector layer 'porirua-tsunami-evacuatio.shp'

Right click on the name of the layer, select 'Open Attribute Table'

The table shows details of the file, each row represent a polygon. After clicking on number of polygon, the polygon is highlighted on the map
There is OBJECTID, which is unique for each polygon, so we will use it as ID for our project.
You can think that it is a bit crazy, we were talking about ShapeToTab and suddenly we are in QGIS investigating details of shp file, but life of shp-user is hard so we have to be prepared for everything. Some shape files consist old administrative districts or administrative districts have two parts, water and land part (true story of Dutch shape file :) such things on in the NL) In Attribute Table you can check if number of polygons is the same as number of administrative districts and so on. Notice that QGIS counts from 0.
I am planning to create basic QGIS tutorial with the most useful options. When I do this, I will place link here.

=========================================================
Before you use ShapeToTab it's worth to simplify geometries of your shape file.
Here you can learn what simplifying geometries of shape files is.
How to do this in:
- MapShaper
- QGIS
=========================================================
Let's go back to ShapeToTab. Press SHIFT and right click on ShapeToTab file, from the menu select
'open command window here '.
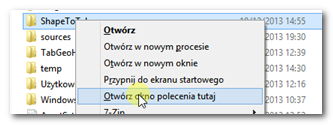
You can write commands in this window. It can happen that your window will be ridiculously tiny and it will make you crazy, then right click on upper blue stripe and select 'Properties' from the menu, you can change size of the window, letters, colours and so on.
Commands:
--info – presents details about the shape file.
--id – unique key (number or text) for each polygon (each row in QGIS), in our example it is OBJECTID. If there is no ID in our shape file ShapeToTab can create own ID.
--simplify [number] – decrease number of points in polygon (numbers which you add are in units of the shape file).
More commands and details of ShapeToTab you will find in the tutorial written by the author of ShapeToTab, Richard Leeke.
Richard's tutorial will provide you with all aspects of ShapeToTab, mine is just a small presentation of basic things (but mine has more pictures lol).
Let's write commands to the window:
shapetotab --id OBJECTID --simplify 10 Sample\porirua-tsunami-evacuatio.shp

The first command in the window doesn't include 'simplify' so we receive 20,041 points, in the last one simplify is 20 and the number of points decreased to 2,179. Lower number of points means smaller file and the map 'answers' quickly when we interact with it in Tableau. Our shape file is not big, so even without simplifying it doesn't look so scary but there are shape files of administrative districts that can originally have over million points (yes, that is creepy, shape file horror movie). There must be balance between decreasing number of points and quality of the map. At the end of the tutorial I will present how I reach the balance :)

- porirua-tsunami-evacuatio_Points – consists shapes of our polygons and ID column.
- porirua-tsunami-evacuatio_Features – consists other columns describing our file (the same which we saw in Attribute Table).


The CSV files are comma-separated.
Open Tableau (any Tableau you have, it will work well in Tableau Desktop as well as free version Tableau Public).
Connect to Data => Text File => Select Points.csv file.
Field separator is 'Comma' by default so we don't need to change anything.

Mark 'Multiple Tables' and add Features.csv, click 'Join' everything is fine Tableau matched ID as should be, so press OK.


If you used TabGeoHack or Joe Mako's software, you can stop reading, as you know what to do.
2. Add point_order to Path
3. Add sub_polygon_id and OBJECTID to Detail
Col_Code to Colour shelf (if you are American then you add to Color shelf...).
4. Longitude => Columns
Latitude => Rows

Now let's go back to –simplify command, if you notice that your map doesn't match to your requirements:
- big white spaces between polygons (your simplify ratio is too high)
- very slow reaction after selecting polygons (your simplify ratio is too low)
You can go back to command window and write new command with other simplify ratio, then your .csv will be change and you have to select in the Tableau's main menu: Data => name of data source => Refresh (you can also click on name of data source in Data tab – right upper corner of the window, right click and select Refresh).
To check quality of the map I suggest, playing with it, clicking on the map, enlarging to level of details which will be useful for your data visualization.
No comments:
Post a Comment